|
|
CAO V12 DIIT Release Notes Version 3.0.1.2480 Nexans
• Material Order feature:
the operator can order all needed material which can then be sent from the warehouse
See detailed description
• New user interface for the web application Graphical Machine Monitoring
A WEB-application to see the machine state; better would be the Mobile machine monitoring http://<Servername>/mmm/
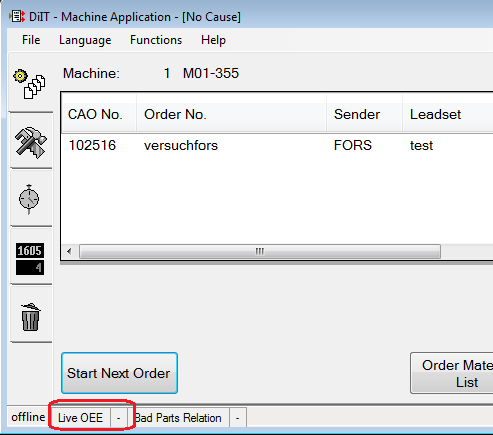
• Live OEE: the current OEE is shown at the machine applications and in the graphical
machine monitoring
The machine application can show a live OEE
• Available at machines with WPCS interface are the following features:
o Material Change Detection
o Job Control
Very new TopWin-Versions have the possibility to detect a change of the raw material. For this some sensors are required (hardware costs are approx. 2000Euro for the terminal end detection).
The “Job-Control” allows the CAO to stop the Komax-machine
• Graphical view of Tools Allocation (future tools planning) and Tools Bottleneck (for
the past) in the Gantt application
See extra description for the tools allocation.
The “Tools Bottleneck”-function tries to give a report of tools conflicts in the past. The main issue is that a tool conflict will occur in the report only, if the order with the missing tool was started and waiting for the tool in machine state “Setup”.
In reality, the operator would continue with another order instead of waiting for a tool. So therefore this report will not show any useful information
• Ticket Designer with zoom function
• New Capacity and Tools reports in the OEE application
Some additional reports in the OEE-application.
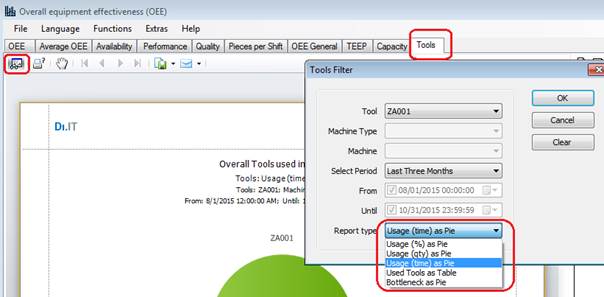
The most interesting report can be the “Usage (time) as Pie”. It shows the minutes of the tools usage at each machine; the time is from the first scan of this tool at the machine till the end of the last order with this tool. Unfortunately this diagram type is wrong; a bar plot would be a better type.
The other reports are almost useless:
- the “Usage (qty)” calculates the quantity of the orders where a tool was used, but don’t consider the order volume
- the “Usage (%)” is the percent value of the “Usage (qty)”
- the “Bottleneck” shows the result of the Gannt-chart (see above)
• Only the leadset name has to match, no check for the production version is made when
a kanban order is used in another kanban cycle
• View in the warehouse for the micrograph quarantine store
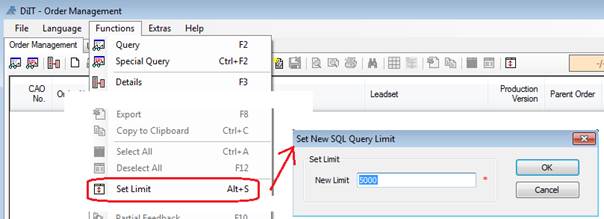
• Limit of rows which are shown can be set all applications
• Select a record and right-click to call a context sensitive function menu. Available in
lists as well as in record details.
• Select a record in a list with double click to call for example the modify function
(configurable).
• Master Data and Order Gateway performance improvements