|
|
Complete the graph and the pie charts using the information below.
Complete this extract from a company report using the prepositions in the box.
| by | on | from | of | up | at | in (2) | to(2) |
The price of our shares has increased 1 from €1 2 in February 2 _____ the present price of €16. The price remained steady 3_____ March and April 4_____ €15. There was a fall 5_____ €2 per share in June. However, this year we have spent a considerable amount 6_____new equipment and, as a result, productivity increased 7_____5% in September. So, the share price rose 8_____ €16 at the end of October. We have recently put 9_____ our prices, and this may lead to a slight drop 10_____ the share price, but we expect to make a full recovery by the end of the next quarter.
Complete the table.
| Verb | Noun | Verb | Noun |
| 1. to cut | a cut | 6. | an improvement |
| 2. | a rise | 7. to increase | |
| 3. to drop | 8. | a decrease | |
| 4. | a fall | 9. to reduce | |
| 5. to fluctuate | 10. | a recovery |
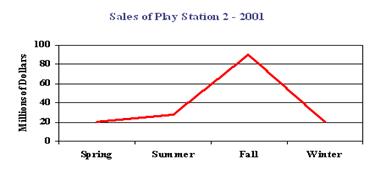
1) What type of graph is displayed above?
| a. Pie Graph | b. Line Graph | c. Scatter Plot Graph | d. Bar Graph |
2) What is displayed on the X-Axis?
| a. Categories - "Seasons of the Year" | b. Amounts | c. Descriptions of the Graph | d. None of the Above |
3) Which of the following shows the correct sales figures from fall to winter?
| a. 20 million to 30 million | b. 90 million to 20 million | c. 20 million to 20 million (no change) | d. 30 million to 90 million |
4) What is the purpose of the title?
| a. To show sales; that sales are in millions | b. To show the seasons of the year | c. To describe the graph | d. None of the above |
5) What is the purpose of this graph?
| a. To show change over time | b. To compare amounts | c. To find differences in height | d. None of these |
Complete the graph and the pie charts using the information below.
| Paradiso growth rate |
 a) The growth rate in Paradiso was around four per cent a year
for ten years. A period of very fast growth followed, with the
growth rate reaching 12 per cent ten years later. Growth was nine per cent in the following three years, but fell to two per cent in the year after that. It then increased steadily to reach five per cent two years ago, and has stayed at that level.
30 20 10 this
years ago years ago years ago year
b) 30 years ago, GDP in Paradiso came 70 per cent from agriculture, 20 per cent from industry and 10 per cent fromservices. At that time, GDP was US$1,000 per person in terms of today's dollars.
Today, GDP per person is US$10,000, coming 50 per cent from industry, 40 per cent from services and 10 per cent from agriculture.
 Paradiso GDP

services
 industry
 agriculture
Paradiso GDP 30 years ago Paradiso GDP this year