|
|
Read the following text and draw the corresponding graph.
The graph opposite covers the years 1976 to 1995. It shows that the number of television viewing hours rose steadily and steeply during that period in the US, starting at just under 5 hours a day to reach more than 7 hours in 1995. There was a slight increase in 1982 and sharper falls in 1986 and 1991. The next decrease, in 1994, is hardly significant. Though we do not have the latest figures, it is unlikely that the trend will have reversed.
8. Comment on the graph below using and organising the following expressions :
Sales rose / went up / increased / climbed ... + adverb (slowly / steadily /rapidly / gradually ...)
Sales stood at ...
Sales peaked / peaked out
Sales levelled out / flattened out
Sales bottomed out
This was due to ...
This was the result of ...
This caused ...
This led to ...
Avoid repetitions ! Conclude by saying whether this graph is typical or not;
Justify your answer.
|
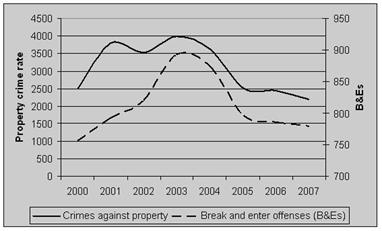
The total property crime rate and B&E rate between 2000 and 2007
Introduction
This report examines the changes in the total property crime rate and the break and enter rate between 2000 and 2007.
Findings.
In 2000 the total property crime rate was 2500 offences per 100 000 population. Then the rate rose 1) …… (sharply/sharp) and reached 3800 in 2001. After a 2) …… …… (moderate/moderately )fall in 2002, the rate started to 3) …… (increase/decrease) again and reached a 4) …… (peak/top) in 2003. However, after 5) …… (stabilizing/fluctuating ) for some months, the total property crime rate dropped 6) …… (considerably/considerable) throughout 2004 and the beginning of 2005. The rate stayed at about 2400 offences from mid-2005 7) …… (to/until) mid-2006 before 8) …… (decreasing/decrease) again.
In 2000 the break and enter rate was about 760 offences per 100 000 population. 9) …… (From/since) 2000 to 2003, there was a steady 10) …… (upward/downward)trend in the B rate. The rate 11) …… (reached/arrived) its highest point in 2003 and then 12)…… (showed/fell) a significant downward trend until mid-2005. After being stable for a few months, the rate continued to fall 13) …… (slightly/slight), dropping to around 780 in 2007.
Conclusion
The total property crime rate fluctuated from 2000 to 2003, whereas the break and enter rate showed a general upward trend. Both rates peaked in 2003, fell significantly until mid-2005, stabilized for some months and 14) …… (fell/grew) slightly during 2006 and 2007 .
Describe the graph given below:
